

We're excited to announce the launch of our new API analytics dashboard! You can now get a visual overview of your Core API request patterns and rate limiting directly in Front. This dashboard makes it easy to monitor your Core API consumption over time, quickly identify which endpoints are generating the most traffic, and spot where you might be hitting rate limits—all without having to piece together information from logs or error messages.
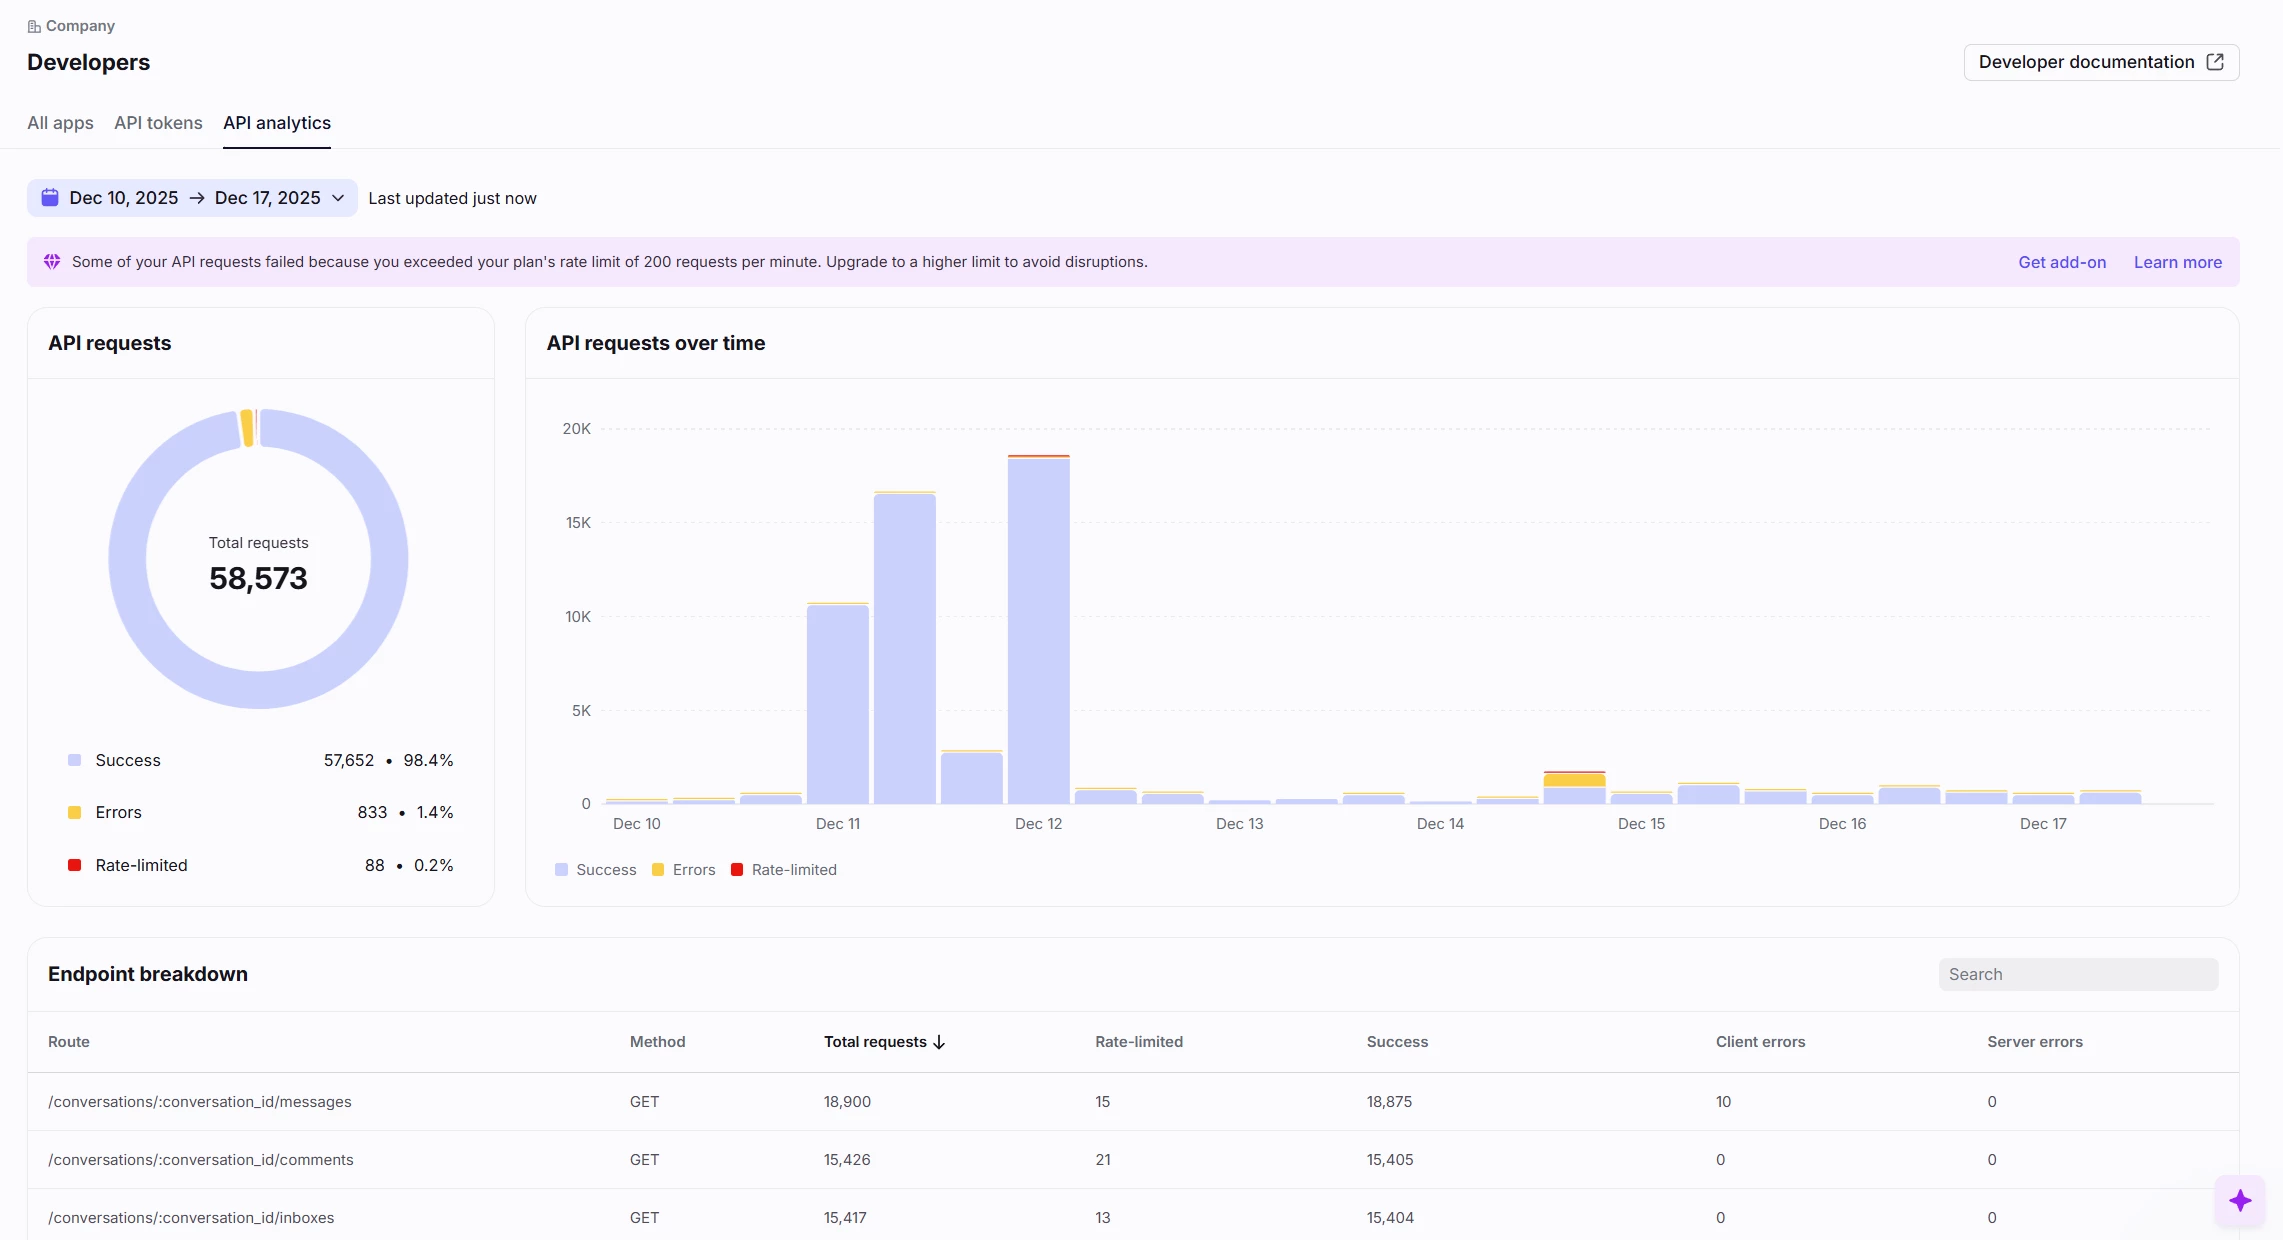
The dashboard features interactive time-series charts showing your total Core API calls (with rate-limited requests clearly highlighted) and an endpoint breakdown table that shows usage by path, including call counts and rate limit hits.
You can view data for the last 30 days and drill down into specific time periods. Company admins can access it by navigating to Settings > Developers > API analytics.
We hope this gives you better visibility into your integration's performance and helps you optimize your API usage!
